Seamlessly connect to unlimited data sources
The platform that partners well with others.


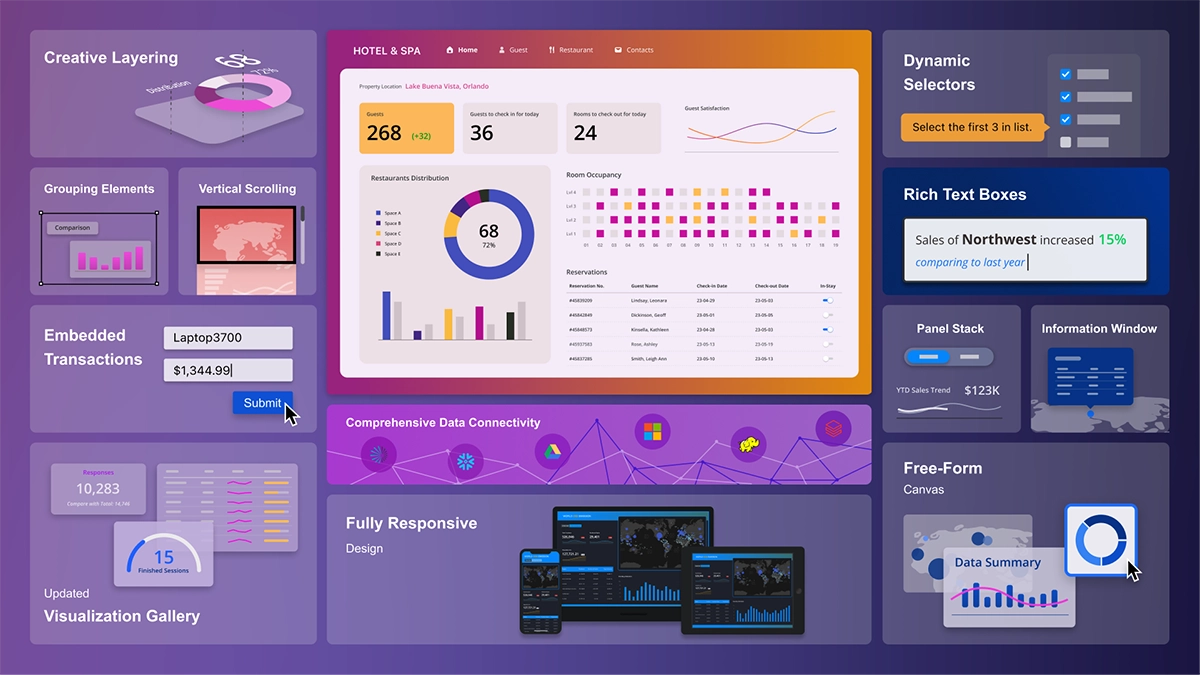
Build rich applications - aided by AI
With our most advanced analytics functionality to date, users can interact with AI chatbots to build visualizations, answer questions, and generate layouts and grids. Self-service reports, and analytic applications can be built with a combination of simple drag-and-drop aided by AI. Users can add in transactional grids, information windows, and what-if analysis to build rich apps.
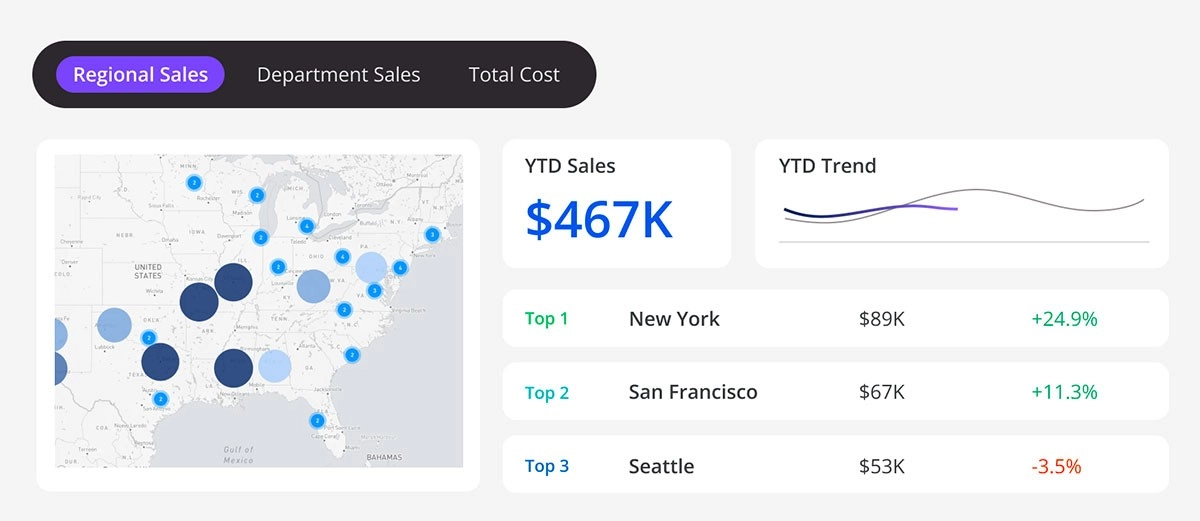
Get visual
Auto Dashboard builds with intention based on the questions you ask and the datasets it has to work with. It might select simple KPI visualizations to easily showcase key metrics. Sankey charts to display data workflows and connections at a glance. Microcharts to show progress towards goals. Transactional grids for enhanced user interaction. Or add in-canvas linking or cross-page navigation for epic data storytelling. It knows exactly what to do.
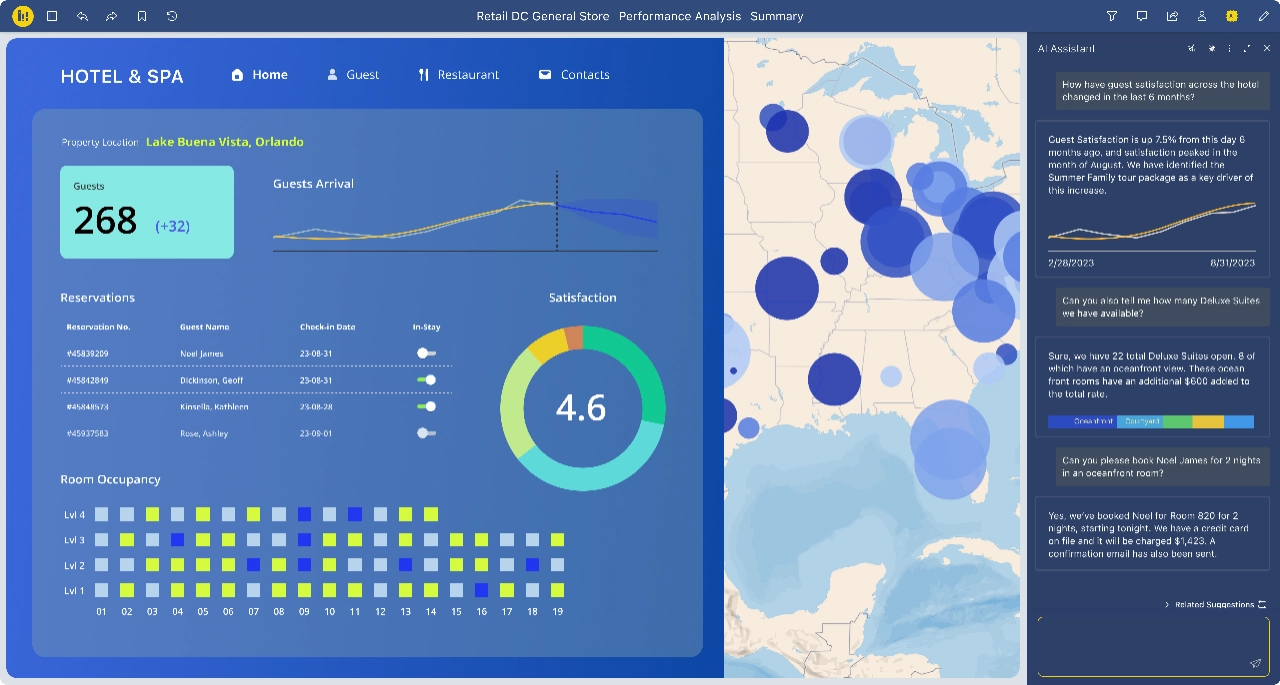
Accelerate analysis with AI-powered apps
Embedded directly in apps, end users have access to their very own AI assistant. Using natural language, ask questions about the dashboard or underlying data itself without the need to navigate complex interfaces or navigation manually. Ask for data points and data summaries ready for presentation, or even update the current view by tasking the chat to make updates. Extract deeper insights to optimize decision-making.